Bruce Mau Know How - To Truly Challenge Yourself, Crunch the Numbers
To really seize the day you really need to seize the data - even if you're 'not a numbers person'
A lot of people in the applied arts and creative industries get into this line of work because they don't really regard themselves as ‘numbers people’.
Bruce Mau would like us to rethink that. He is chief design officer of Freeman, one of the world's largest brand-experience companies, and co-founder/CEO of Massive Change Network (MCN), a Chicago-based global design consultancy. He has applied the power of design to transforming the world, and critical thinking to the design process.
His new book, Bruce Mau: MC24, brings together 24 global, generous, and galvanizing principles to overhaul the way we think and to inspire massive change.
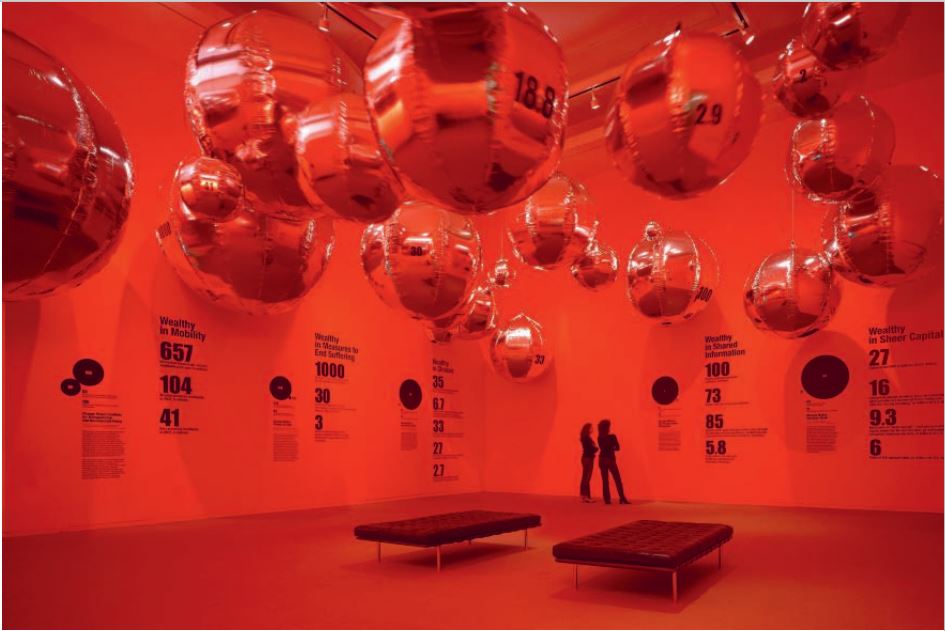
One of these, entitled Quantify and Visualise: Seeing is Believing, advocates for the use of data within the design process. Some of the examples in the book deal with carbon emissions and climate change – one of Mau's chief concerns – but others look at how individuals can improve their work by crunching some numbers.
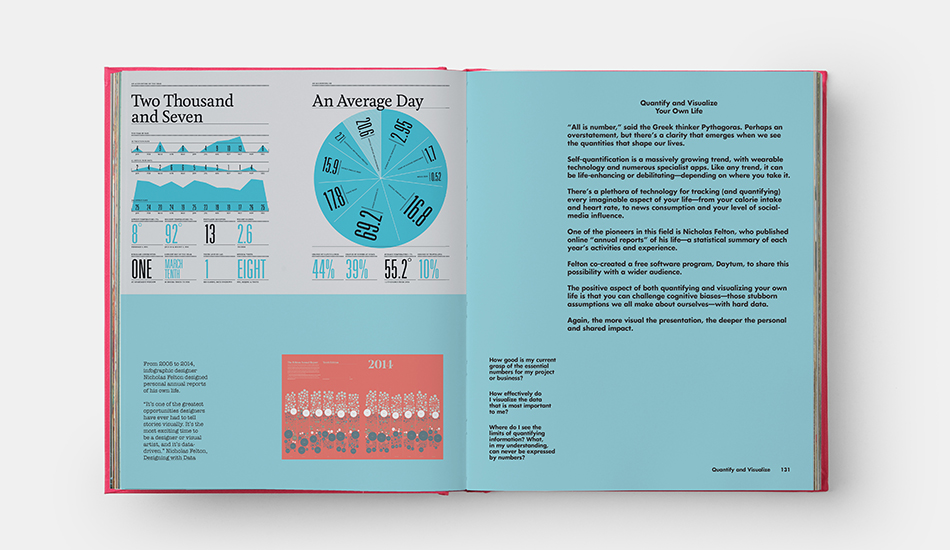
"Self-quantification is a massively growing trend, with wearable technology and numerous specialist apps,” writs Mau. “Like any trend, it can be life-enhancing or debilitating — depending on where you take it. There’s a plethora of technology for tracking (and quantifying) every imaginable aspect of your life—from your calorie intake and heart rate, to news consumption and your level of social media influence.
“One of the pioneers in this field is Nicholas Felton, who published online ‘annual reports’ of his life — a statistical summary of each year’s activities and experience,” Mau goes on to explain.
Felton, it should be pointed out, isn’t just some spreadsheet wonk. The US designer has had his work featured in New York Times, Wall Street Journal, Wired, and is perhaps best known for co-creating Facebook’s timeline.
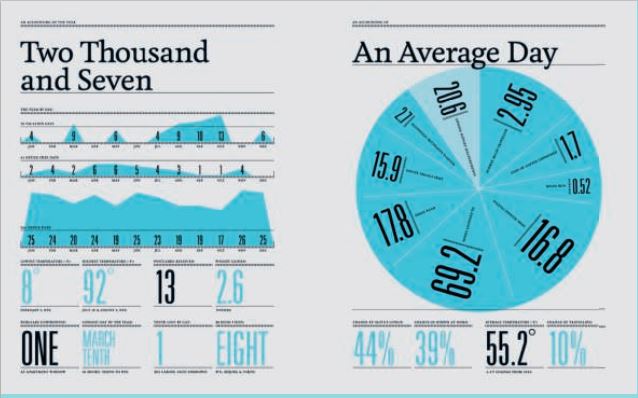
His annual reports, which Felton dubbed the Feltron Project, ran from 2005 to 2014, might sound a little self-centered, but Mau believes other, less numerate designs could also benefit from a little number crunching, to answer questions such as: How good is my current grasp of the essential numbers for my project or business? How effectively do I visualize the data that is most important to me? Where do I see the limits of quantifying information? What, in my understanding, can never be expressed by numbers?
“The positive aspect of both quantifying and visualizing your own life is that you can challenge cognitive biases—those stubborn assumptions we all make about ourselves—with hard data,” he writes. “The more visual the presentation, the deeper the personal and shared impact.”
Indeed, there’s no excuse not too; as Mau points out, Felton co-created a free software program, Daytum, to share this possibility with a wider audience. To seize the day, you really need to seize the data.
For more global, generous, and galvanizing principles to overhaul the way we think and to inspire massive change, whether we’re in splendid isolation or the concrete jungle, order a copy of Bruce Mau: MC24 here. Practical, playful, and critical, it equips readers with a tool kit and empowers them to make an impact and engender change on all scales, from the personal to the global.